I love the idea of being able to get the status and history of temperatures and humidity around my house. You can use the data to infer certain things like when a shower is being taken, a door/window being left open, or when you’re heating a room you don’t need to. I can use this data to re-balance my forced-air system as well.
Please understand that I do not recommend the use of unencrypted wireless devices in any way, shape, or form for control systems. There are major safety vulnerabilities that can crop up from otherwise, well-written code. The data generated from these devices is used to help me make an informed decision about my environmental control. The data is not tied into a control loop at all.
The units that are available on the market are typically bluetooth and require an app to read the data. WiFi units send the data off to “the cloud” and likely log everything, but can be accessed by a phone/browser.
So what’s a good compromise between designing my own hardware and giving all of my information away to China? Enter Aaron Christophel!
I saw a post on Hackaday about Aaron Christophel modifying the firmware of $2 Xiaomi thermometers from Aliexpress. So I went ahead and bought 16 of them to scatter around the house.
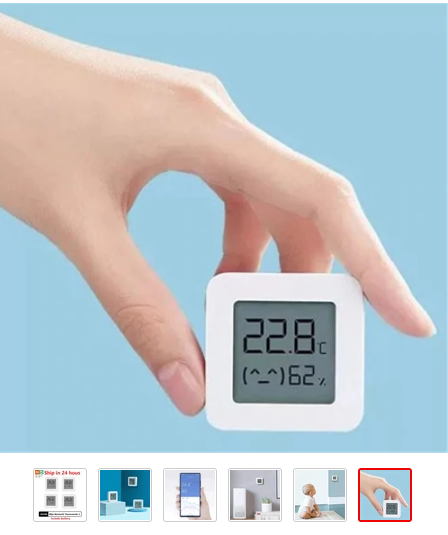
The problem Aaron is trying to address is the fact that these thermometers obfuscate temperature and humidity data contained within their broadcast information. There is a way to pull this data out if you know the token and bind key (something the app does). But Aaron’s firmware takes out the need for bind keys and tokens and instead lets the thermometers broadcast the data as plain text so to speak. No app, and a simple python script can read the data.
Aaron wrote a really nice bootloader that uses google chrome and your computer’s bluetooth radio to flash new firmware on to the units. It’s a little slow taking about 1 minute to connect, activate, and re-flash the unit’s firmware.
Step 1: Preparation
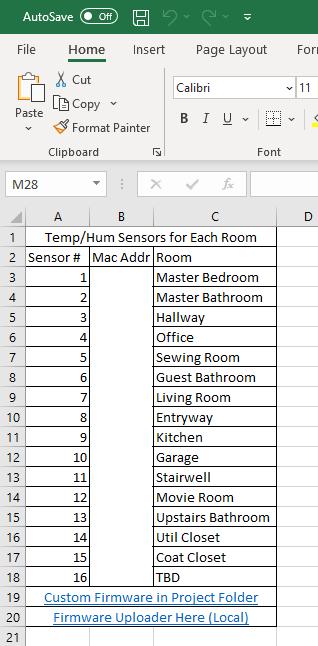
Out of the 16 units I purchased, I only ended up deciding on locations for 13 units. Deciding on a location is the first step. Next you’ll transfer all of the locations to an excel spreadsheet as a column. Next door to the locations column you’ll put the mac address column. This will help you form an array later for matching up broadcast mac addresses with the rooms the devices are in.
Step 2: Re-Flashing Firmware
I’m condensing Aaron’s instructions here, but a full how-to exists on the project’s github page. First, download the ATC_Thermometer.bin file. This is the new compiled firmware that Aaron wrote. Okay now is when you use Aaron’s web-browser DFU tool. Select the .bin firmware file, connect to the thermometer, activate the thermometer, and then start flashing.
Keep an eye on the progress bar, and when it gets up around 90% watch the bottom right two digits on the thermometer. They will flash the last 3 bytes of the mac address in hex. Write these six characters down as you’ll need to pull the battery and put it back in to get it to display the mac again. If you have lot’s of devices it’s important to have the mac address written on the unit.
Before writing the address on the unit however, connect to the device via bluetooth and change the appropriate settings that make you happy. For example, I set my devices to display Fahrenheit, and to show the battery in the LCD. We do this step first to double check the mac address because the number 6 displays as the letter b and that can introduce problems if you read and wrote the address incorrectly.
Once you’re sure you’ve got the correct mac address for the correct device, go ahead and scribble down the address on the bottom of the unit. I chose the bottom because I could still read the address once they’re adhered to the wall. Add this mac address to your spreadsheet and now you have a relationship established between the room and the mac address.
Step 3: Parsing and Aggregating Broadcast Information
Tom Nardi has a good writeup exploring the software side of this project, including some example code to get you started reading data off of the sensors. I’ll post the full code below as I had to make several modifications to filter out redundant information his code would be saving. My script also saves the data to an array of verified sensors and then writes that to a file. This is important because the py-bluetooth-utils runs until keyboard interrupt, and the devices will all update their broadcast information out of sync. This isn’t 100% the best way to do this, but python really isn’t good at running continuously if your script is super bloated.
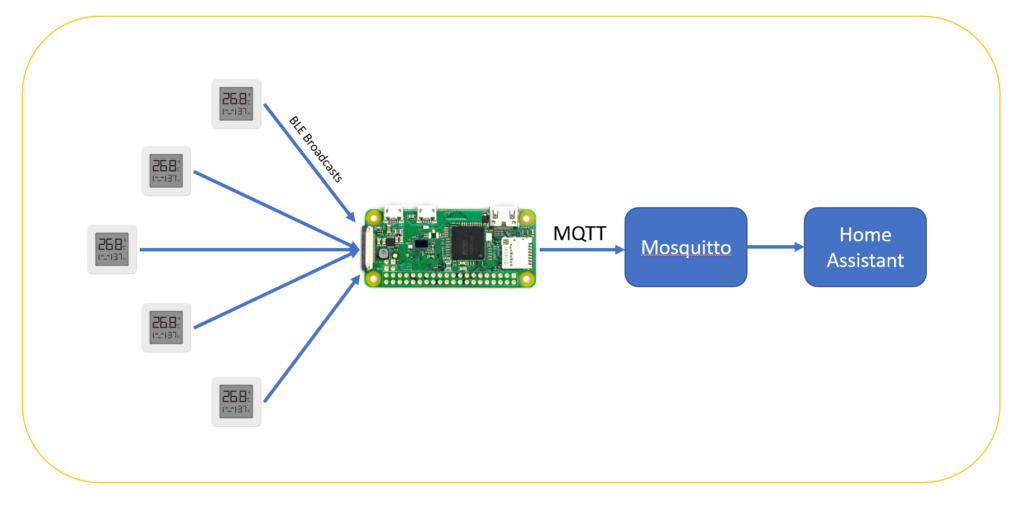
I wrote a script that runs on startup and simply writes all values broadcast by the thermometer to a 2Dx1 array and then writes that information to a file. This has been running stable for over a month now on a raspberry pi zero w.
Step 4: Publishing MQTT Information
If all you want to do is log this data to a CSV file then you’re pretty much done here, except for generating a CSV file. But if you’d like to get the information into a web service, I’d recommend using mqtt since it’s a fairly lightweight protocol and Home Assistant plays nice with mqtt. I wrote a second script which reads the output file written to by the BLE listener, and parses it into MQTT topics with data. A chronjob runs this second python script which publishes data once per minute (which is the refresh rate of the sensor).
Step 5: Receiving and plotting the sensor data in Home Assistant
If you just want the data aggregated in a place that you have control over and can plot then Home Assistant is a pretty good option. There’s also plugins available for HASS such as GRAFANA if you want more graphing options. I’m not going to go into Home Assistant setup but will outline how to install and configure the Mosquito MQTT Plugin and add the published data as a “sensor”
Step 6: Viewing and acting on Data
Since these sensors are not part of a control loop, we’ll use the information to make manual adjustments.
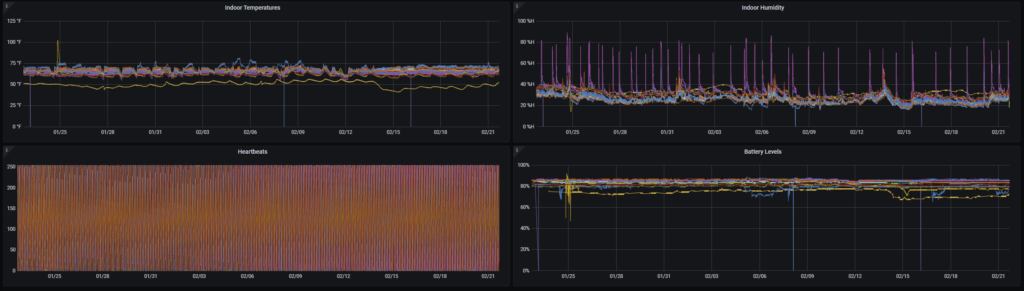
As you can see here,
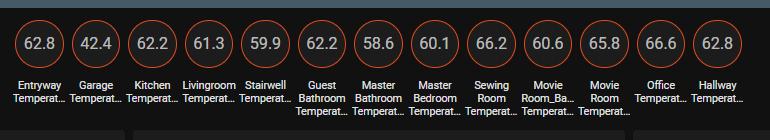
My Movie Room (upstairs bedroom) temperature is about 6 degrees hotter than the rest of the house. While this doesn’t look so odd at first glance, I’ll say that the movie room is heated with electric baseboard heating. This means we’re spending more money heating a rarely-used room above what we consider a comfortable winter temperature. Clearly a point of cost savings.
Another thing you can do is determine if a room has proper ventilation. Below is a historical line graph of the relative humidity of the master bathroom.
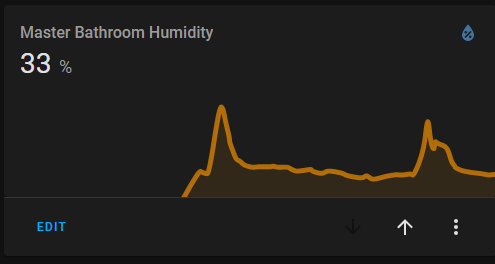
See those spikes? Those indicate a shower was taken. The current relative humidity outside is 40%, so seeing the spikes return to “baseline” in a timely manner, indicates good air flow. Since our master bathroom doesn’t have a vent fan, this is an important variable to monitor to combat mold growth. From the looks of this, we don’t need to install a vent fan.
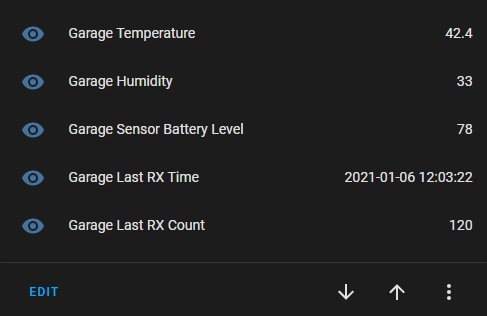
These sensors are marketed to last about a year on one coin cell. I’m sure their battery life could be extended by changing the broadcast interval in the firmware, however, planned sensor maintenance can be carried out as the sensors are broadcasting their battery level!
We can even determine a failure based on current time and the Last RX Time variable. If it’s last reported battery level was 50% and the last RX time was 2 days ago, the unit is probably dead or the scanning computer can’t pick it up anymore.
Closing Comments
So why all this hassle? Why not just use the xiaomi app and not hack the sensors? You’ve seen that this data can be used to infer more than just the temperature of a house. A company can gather some serious data about your behaviors all the way down to your showering habits, yikes!
Update: 2-21-21
I’ve started using Grafana and InfluxDB to store and graph my information. It works much better than the built-in graphing in Home Assistant.